AI Energy Grid Mapping Gives China Strategic Edge
AI energy grid mapping gives China a complete renewable energy inventory, enabling national coordination other countries lack.

AI energy grid mapping has given China a strategic advantage that no other country has yet matched. A study published in Nature this week by researchers from Peking University and Alibaba Group’s DAMO Academy has produced a complete, high-resolution, AI-generated inventory of every solar and wind installation across the nation. The dataset identifies 319,972 solar photovoltaic facilities and 91,609 wind turbines, processed from 7.56 terabytes of sub-metre satellite imagery. This is not a research exercise in isolation. It lands at a moment when artificial intelligence itself is straining power grids worldwide, and when the ability to coordinate renewable energy at a national scale has become a hard requirement, not a luxury.
The Inventory the World Lacks
319,972 solar photovoltaic facilities. And 91,609 wind turbines. It's what a deep-learning model found across 1,915 Chinese counties, scanning sub-metre satellite imagery for installations from rooftop panels in coastal cities to utility-scale wind farms on the Mongolian plateau. No other country possesses a comparable, nationally consistent, county-level inventory of its renewable infrastructure. The dataset's a demonstration of what large-scale geospatial AI delivers when applied to infrastructure problems, and a template that other nations could, in principle, replicate. But the lead's already embedded in real operational terms.
- 319,972 solar photovoltaic facilities
- 91,609 wind turbines
- 7.56 terabytes of satellite imagery processed
A Grid Under Pressure
The 44% Shock
China's AI-driven electricity demand is surging at a pace that grids weren't designed to handle. In the first quarter of 2026, data centre and computing services pushed sector power consumption up 44% year-on-year to 22.9 billion kilowatt-hours, according to the China Electricity Council. But this rapid expansion isn't exceptional. The International Energy Agency projects global data-centre electricity consumption could approach 1,000 TWh by the end of this decade. In the US, capacity market prices in PJM, the country's largest grid operator, have risen more than tenfold in two years, driven primarily by data-centre growth. European utilities are scrambling to upgrade transmission. The ability to coordinate energy sources through AI energy grid mapping at national scales is what most countries still lack. China just filled that gap.
- 44% year-on-year power consumption rise in Q1 2026
- 22.9 billion kilowatt-hours consumed
- IEA data-centre electricity projection nearing 1,000 TWh by decade's end
- US PJM capacity prices up tenfold in two years
Why Weather Balances Weather
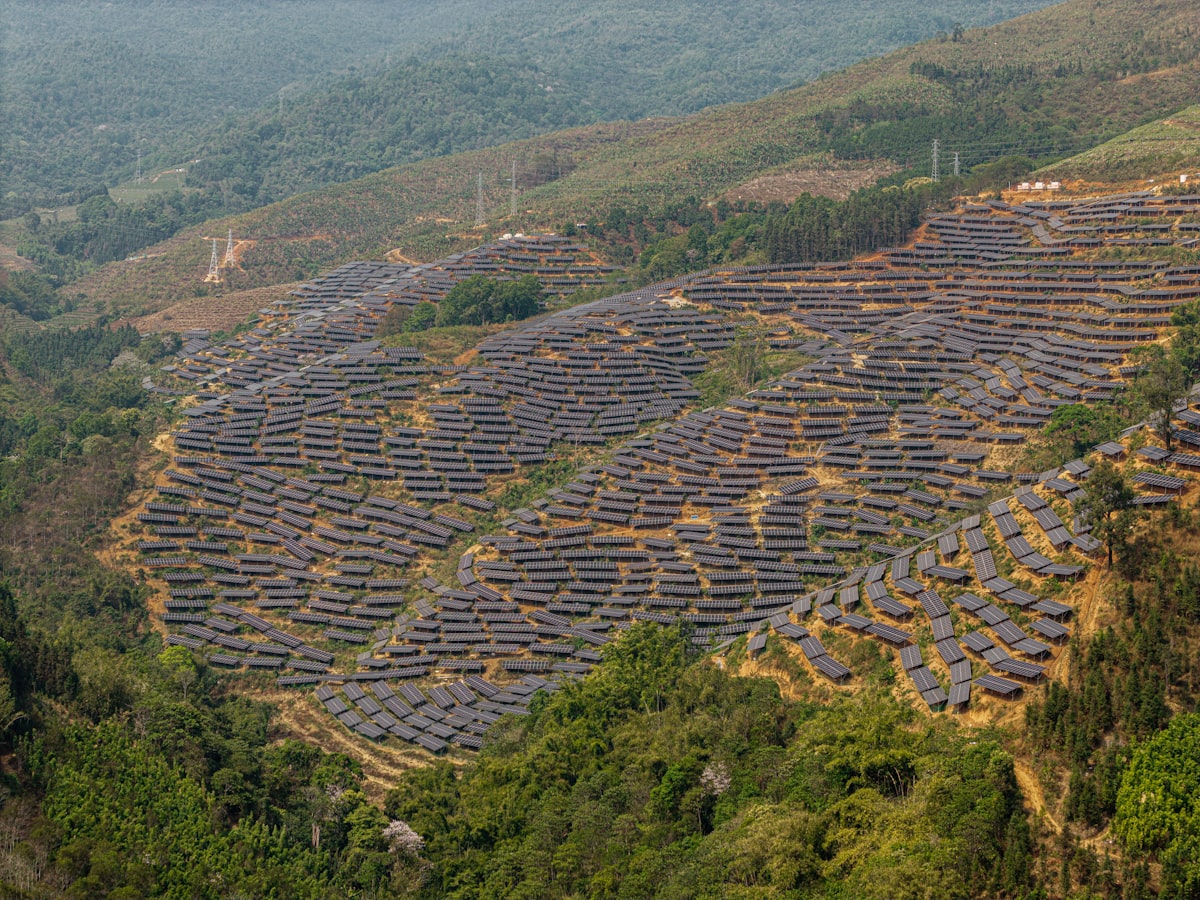
Solar-wind complementarity, the idea that two sources offset each other’s variability in time and geography, until now has largely been studied through modelled scenarios. What happens under real-world infrastructure was unclear. The new AI energy grid mapping makes it quantifiable. The researchers found that when you pair facilities hundreds of kilometres apart, a cloud that darkens solar farms in Gansu doesn’t touch wind corridors in Inner Mongolia, reducing overall generation variability sharply. China's clean energy boom is often framed as a story of scale. Gigawatts added. Records broken. But that framing misses something. Until now, neither grid operators nor policymakers had a unified picture of where every turbine and panel actually sat. The mapping published this week changes that calculus.
“God’s-eye view,” Liu Yu, a professor at Peking University’s School of Earth and Space Sciences, described the inventory.
Coordination's provincial, not national. Transitioning to a unified national scale would make it easier to pair complementary sources, stabilise the grid, and avoid curtailment, the wasting of generated renewable power that's long been one of China's most costly clean-energy problems.
From Provincial to National
Provincial Silos
Province-level grid management means a region's surplus wind often can't be dispatched to offset solar shortfall hundreds of kilometres away, but researchers argue the inventory makes a national coordination model operationally feasible for first time. That blind spot is erased. Without a complete picture grid operators can't optimise what they're not aware of, but now curtailment representing billions of yuan in foregone clean generation each year can be tackled with precision. It's no theoretical efficiency gain. It directly improves the economics of China's clean energy sector, which generated an estimated
Open Data, Open Advantage?
Dataset and code on Zenodo. By open-sourcing this AI energy grid mapping, the researchers aren't just sharing a result; they're offering a methodology that other countries can study and adapt. In a global race to build grid-aware AI infrastructure, having a template is valuable. But executing it's harder. Processing 7.56 terabytes of imagery into a nationally consistent inventory took deep expertise and computing muscle. The lead conferred by having the mapping already completed, with operational insights already flowing into infrastructure planning, is real. The question now isn't whether other nations will attempt to replicate the feat, but how many years it will take them to close the gap.
Frequently Asked Questions
What is AI energy grid mapping?
AI energy grid mapping uses artificial intelligence to create detailed, real-time maps of energy infrastructure, optimizing distribution and predicting demand.
How does AI energy grid mapping give China a strategic edge?
It enhances energy efficiency and reliability, supporting China's rapid industrialization and technological dominance while reducing waste.
What technologies are involved in AI energy grid mapping?
It combines machine learning, IoT sensors, and satellite imagery to analyze and manage energy flows across vast networks.
Can AI energy grid mapping help integrate renewable energy?
Yes, it balances intermittent sources like solar and wind by predicting output and adjusting grid operations dynamically.
What are the risks of AI energy grid mapping?
Potential cybersecurity threats and data privacy concerns arise, as centralized AI systems become critical infrastructure targets.

Marcus Thorne covers the fast-moving field of artificial intelligence, with a particular interest in large language models, automation and the companies driving the technology forward. He aims to cut through the hype and explain what these systems can and cannot do.
💬 Comments (0)
No comments yet. Be the first!